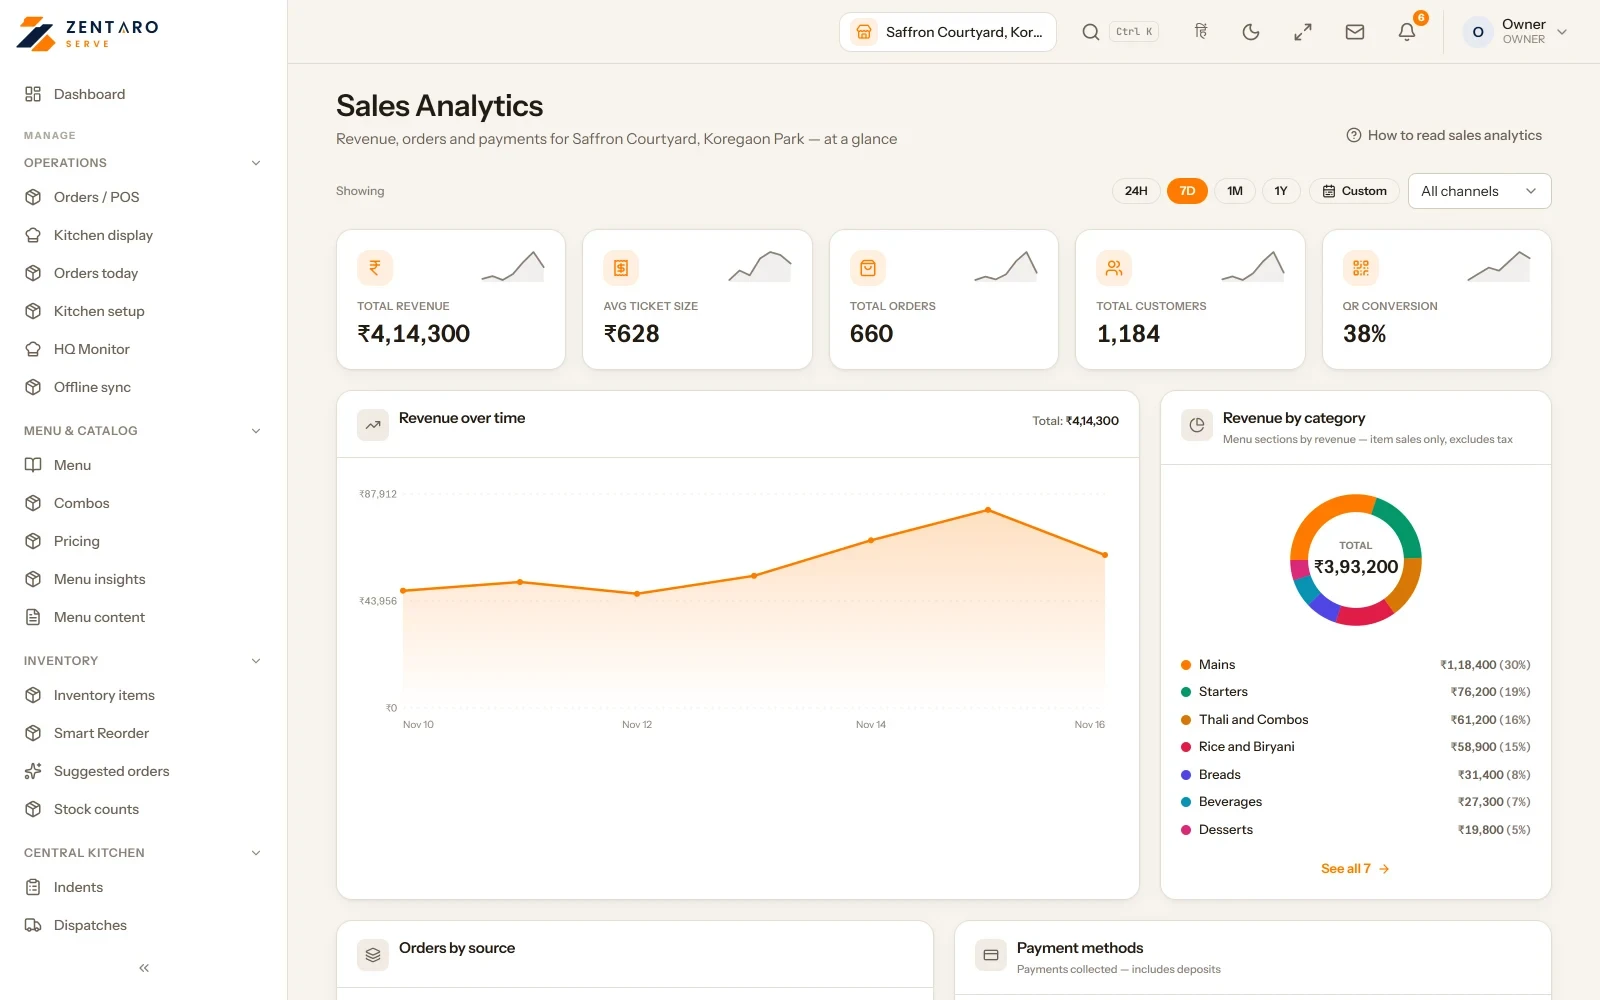
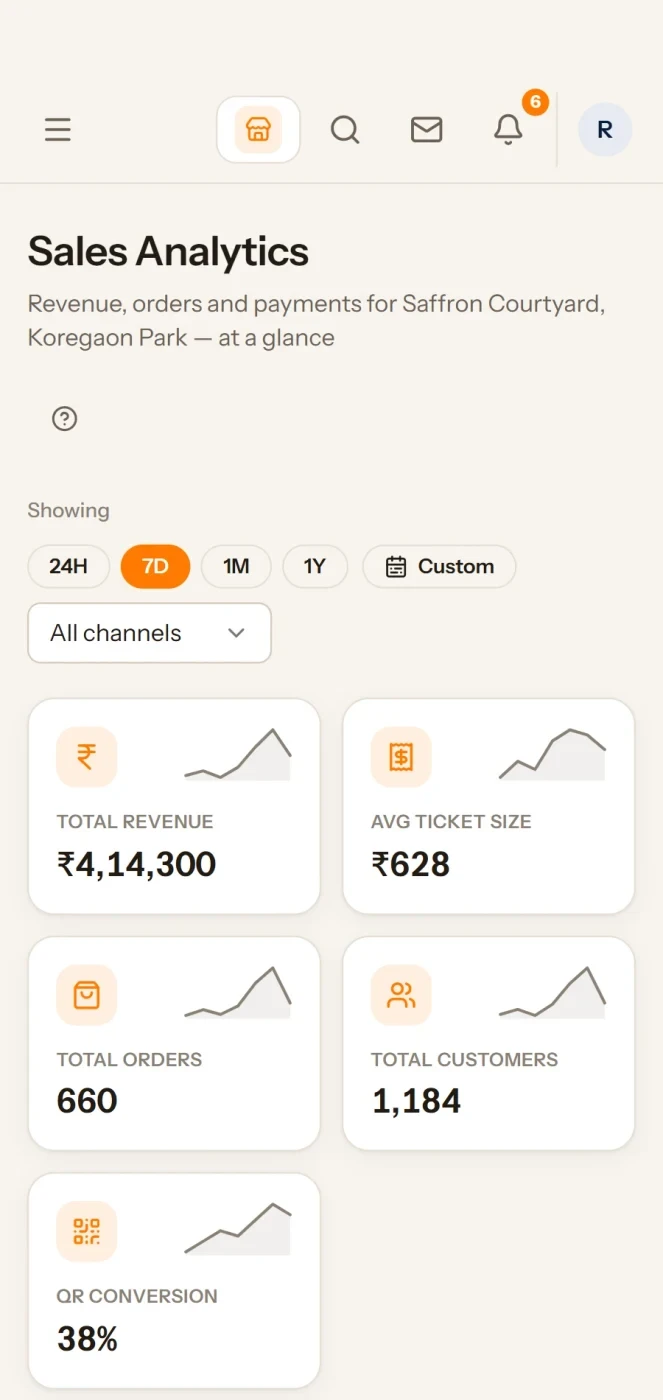
Analytics & reports Restaurant analytics and reports, measured not felt Restaurant analytics and reports show what sold, what it cost and where money leaks. In Zentaro Serve you see a sales report for each outlet and channel, a menu report that uses real plate cost, and discounts by person and reason.
Sales you can act on Menu engineering with real costs Lost margin, by person and reason Revenue and advances Without it
The best-selling dish and the most profitable dish are assumed to be the same one. Discounts are a total, not a pattern with names attached. Cash received and revenue earned get conflated, so advances flatter a month.
What it does. See sales by outlet, period and channel. You can check a hunch against the numbers.
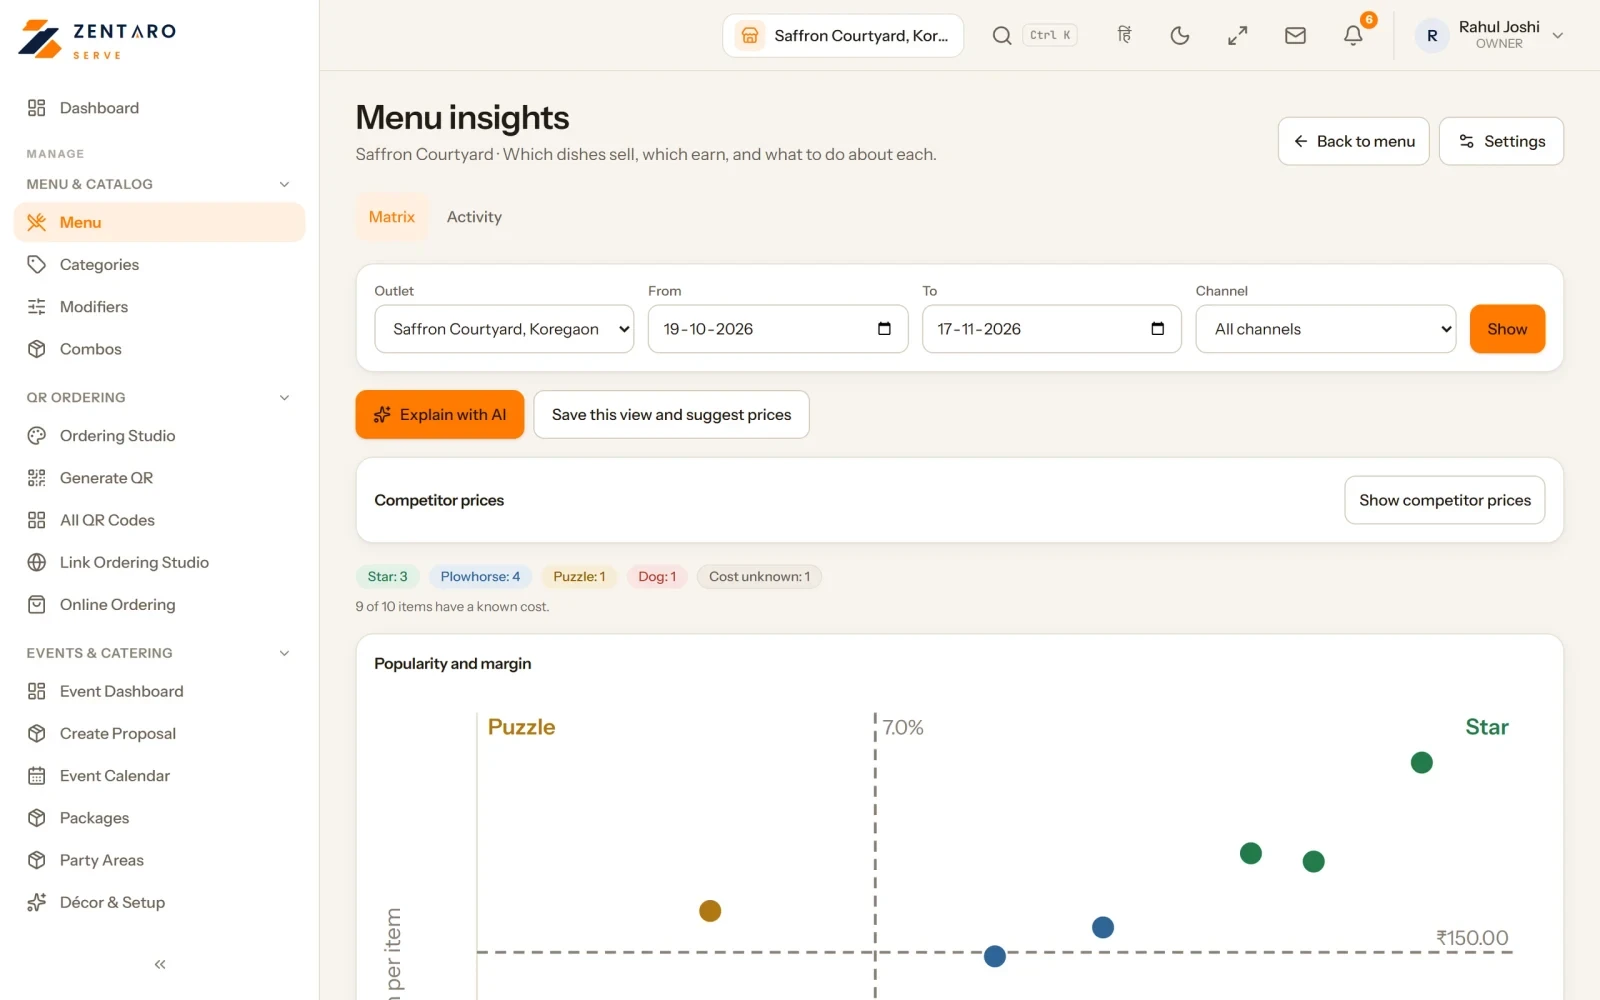
Menu engineering with real costs Your sales mix is set against real plate costs. Stars, workhorses, puzzles and dogs are sorted by margin, not volume.
Lost margin, by person and reason Discounts and giveaways show who gave them and why. This is often the quickest number to act on.
A revenue and advance report shows advances apart from sales.
Service and upsell are measured for each person. Coaching can aim at the right person.
Suggested actions, not just charts Your sales and margin point to dishes to promote, reprice or remove. The suggestions come from your numbers, not from AI.
How it works. The day is written down for youautomated Every order, discount, void and payment, as it happens.
Costs attach to dishesautomated Plate cost follows buying prices, so margin is current.
Patterns show upautomated Which dishes earn, where discounts leak, which outlet is slipping.
Exported for your booksautomated Finance and tax work can carry on outside the app.
Try it. Margin per plate ₹273
Food cost 35.0%
Sells per week 84 plates
Weekly contribution ₹22,932
Workhorse
Example figures, for illustration only.
Product screens The screens you and your team will use for this.
Sales report Menu insights
Example screens with sample data
The problem you know
Why restaurant numbers arrive too late You think the best seller is the best earner. It is often not. You hear about last night at noon. Discounts are one total, not a pattern with names. How do the sales report and the menu report work? Open the day from your phone or laptop. Look at sales by outlet, period and channel. Open menu insights to see which dishes earn, using real plate cost. Check discounts by person and reason. Export for your accountant. What restaurant analytics and reports include The AI daily briefing, which includes the morning summary, once AI is switched on. A leak watchdog that flags possible losses. Outlet benchmarking, to compare your outlets with each other. Dish demand, and a prep forecast for the kitchen. Menu engineering sorts dishes into stars, workhorses, puzzles and dogs. A revenue and advance report, so advances are shown apart from sales. What it is not
Sales and analytics reports, menu insights, and a comparison of outlets. AI helpers are optional and described on their own pages. Who reads the reports Who it is for
Owner and head office: the whole picture. Manager: their outlet. Talk to us. Talk to us
Morning figures, menu performance and cancelled orders The morning summary Yesterday's figures by WhatsApp are built and in testing. Turn it on or off at any time. It is not set up for every country yet. Which dishes earn Every item is placed as a Star, a Puzzle, a Plowhorse or a Dog from how popular it is and how much it earns. It shows a menu score from 0 to 100, your best seller, and items that often sell together. Margin shows only for items that have a cost. Nothing is guessed. Dish demand forecast See what each dish is likely to sell, and why. The forecast is tested on past days. You can change one day's figure. It is on plans that include operations planning. Cancelled orders See orders that were taken and then cancelled, day by day for the last days. The top reasons are ranked. Search by order, customer, server or reason. Tap a row to see the items, who took the order and when it ended.
Common questions. What can I see in reports? Sales by outlet, period and channel, menu engineering with real plate costs, and discounts by person and reason.
Can I export reports for my accountant? Yes. Finance and compliance work can continue outside the app.
Does Zentaro Serve give advice? Yes. Your sales and margin point to dishes to promote, reprice or remove. The suggestions come from your numbers, not from AI.
What reports does a restaurant POS give? Sales by outlet, period and channel, menu insights with real plate costs, and discounts by person and reason.
How do I see which dishes make the most profit? Open menu insights. Dishes are sorted by margin, not just volume, so a popular dish that earns little shows up.
Can I see sales for all outlets in one report? Yes. Benchmarking compares your outlets, and the head office view covers all of them.
Do I need AI to read my reports? No. AI is optional. The reports work without it.
Tell us about your restaurant. Zentaro Serve launches in 2027. Tell us what you run today and we will get in touch.
Last updated: 16 November 2026