
Compare shares, not totals
A big outlet sells more and spends more. Totals do not tell you which outlet is run well. Percentages do.
- Food cost as a percent of sales.
- Voids and discounts as a percent of sales.
- Wastage as a percent of food bought.
For this to work, every outlet must use the same names and recipes. That is the standard menu. Read about it in franchise vs company outlet reporting.
The review order
Each step answers one question. The order puts the biggest money first.
- Food cost by outlet. Is any outlet spending more on food than the rest? This is usually the largest cost you control.
- Voids and discounts by outlet. Is any outlet giving away more than the rest? This points to control, training or misuse.
- Sales by hour. Do the busy and slow hours match what you expect? This points to staffing and offers.
- Wastage, only where needed. If food cost is high, wastage often explains it.
Fifteen minutes is enough for three outlets.
How to decide an outlet is off
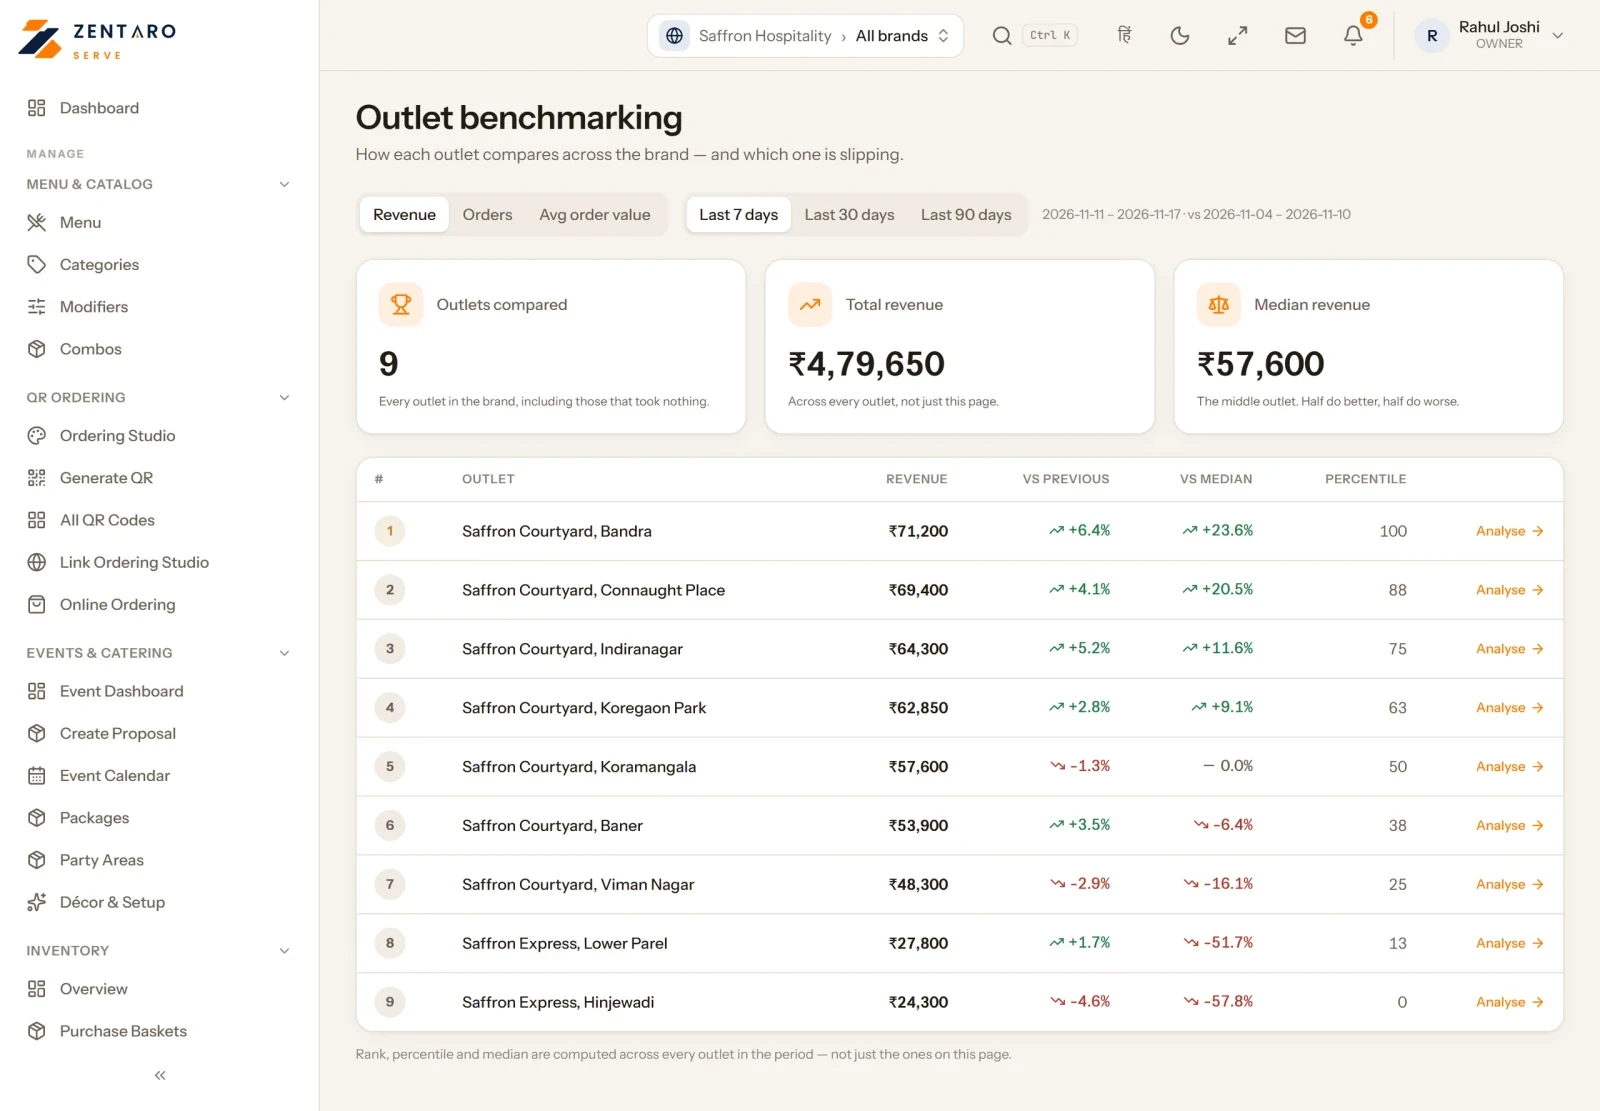
Do not pick a number out of the air. Use the middle of your own group.
- Write the number for each outlet.
- Find the median, the middle value.
- Flag any outlet more than a set gap from the median. Choose the gap yourself, such as three points on food cost.
A median is fairer than an average, because one extreme outlet cannot pull it.
Example: three outlets, one weekly review
This is an example, with made-up numbers for one week.
| Report | Outlet 1 | Outlet 2 | Outlet 3 | Median | Flag |
|---|---|---|---|---|---|
| Sales | 300,000 | 240,000 | 180,000 | ||
| Food cost, percent of sales | 30 | 31 | 38 | 31 | Outlet 3 is 7 points above |
| Voids and discounts, percent of sales | 2.1 | 2.4 | 2.2 | 2.2 | None |
| Wastage, percent of food bought | 3.0 | 3.4 | 8.5 | 3.4 | Outlet 3 is 5.1 points above |
Step 1: food cost. Outlet 3 stands out at 38 percent. Step 2: voids and discounts are normal everywhere, so control is not the issue. Step 3: sales by hour for Outlet 3 show nothing odd. Step 4: wastage. Outlet 3 is at 8.5 percent against 3.4 percent for the middle outlet.
Now the picture is clearer. Outlet 3 sold 180,000 at 38 percent food cost, so it spent 68,400 on food. At the group median of 31 percent it would spend 55,800. The gap is 12,600 a week. Wastage explains part of it: 5.1 points of the 68,400 bought is about 3,500. The other 9,000 or so is not wastage, so look at portions and buying prices as well. A call to the Outlet 3 manager now has numbers behind it. Ask about ordering amounts, portions and date checks. Our wastage register helps the manager see why.
Sales by hour
Look at the shape of the day for each outlet. Do the busy hours line up with staff on duty? Is there an empty window that could take an offer? See happy hours.
Compare each outlet with itself last week first. Then compare with the others.
Then look at the menu
If an outlet's food cost is high and wastage is normal, check which dishes drive it. A dish that costs more at one outlet may have a different portion, a different supplier or a different recipe. Compare plate costs for the top sellers.
Keep a routine
Review on the same day each week. Send each manager their own page, and ask for one action. Check at the next review whether the action was done. A report that nobody acts on is just a report.
Common questions
Which reports should a multi-outlet owner check first?
Food cost by outlet, voids and discounts by outlet, and sales by hour. Then wastage for any outlet that stands out.
Why compare percentages and not totals?
A big outlet and a small one have different totals. Percentages make them comparable.
What is an outlet comparison report?
A report that sets outlets side by side on the same numbers, such as sales, food cost, voids and wastage.
How do I decide an outlet is off?
Find the median of the group and flag any outlet beyond a gap you choose, such as three points on food cost.
Why do I need a standard menu?
It gives every dish the same name and recipe in every outlet, so the numbers can be compared.
Where Zentaro Serve fits
Zentaro Serve has a comparison of outlets and sales and analytics reports. One company can hold brands, regions and outlets.
See multi-outlet software